No study needed. Stoned Drivers Pose Deadly Threat
An editorial in the Boston Herald proclaimed “No study needed: Stoned drivers pose deadly threat.”
The Associated Press recently disclosed the results of two new studies attempting to determine the impact on traffic deaths in states that have legalized recreational marijuana. Both suggested that laws legalizing recreational marijuana may lead to more traffic fatalities.
We wouldn’t think a comprehensive study would be required to reach that conclusion…
We don’t need high-brow medical research to realize that in Massachusetts and other recreational-pot states, your chances of running into a substance-impaired motorist can only increase.
And that collision could cause serious injury or death.
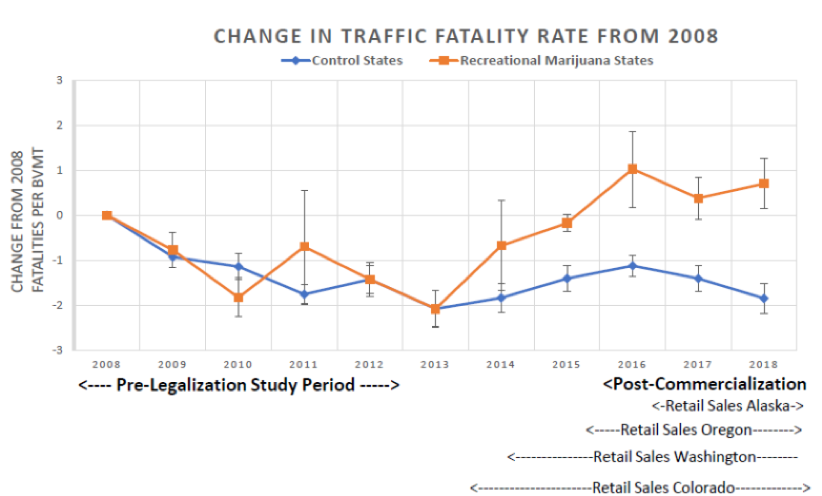
I was the lead author of one of the papers they referenced. We found a 20% increase in number of traffic fatalities in the first 4 states to legalize recreational marijuana. We calculated that if every state legalized marijuana, there would be 6800 excess deaths each year. Yet, I agree with the Boston Herald. It shouldn’t require linear regression difference-in-difference analysis of panel data to prove the obvious. If more people use an intoxicant, there will be more impaired drivers which will lead to more roadway fatalities. The only surprise was the magnitude of the number of deaths.
It only took a quick look at the US DOT traffic fatality database to see that fatalities increased in states after they allowed commercial sales of recreational marijuana. But, I had to enlist the help of a Harvard math student to put the information in a way that would satisfy a scientific journal, replete with regression coefficients, confidence intervals and p values.
Even then, the first peer reviewer complained that our results were “simply not plausible.” Well, our study is not only plausible, it is accurate. The majority of laypeople, like the Boston Herald editorial staff, don’t even think our findings were newsworthy because they were expected. My brother falls into that category. I was so proud of getting my paper published in a top journal, I called my brother the lawyer. Bursting my bubble, my older brother told me without hesitation, “Big deal. Of course fatalities go up.”


I do not want to single out your junior member of the publication, “to enlist the help of a Harvard math student to put the information in a way that would satisfy a scientific journal, replete with regression coefficients, confidence intervals and p values. “
I do think that the matter resounds with “truthiness,” and lacks “proofiness.”
Firstly, the data is presented in percentages, which leads to more dramatic charts but not to proof. in 2013, the US death rate was 32,000 deaths across the board. How does that compare to the selected states? How about deaths per vehicle-miles-traveled, which is how the graph is presented?
When beginning the workup of a study in statistics, one looks for the three gremlins of chance, bias and confounding.
We do notice from the CDC that “US crash deaths fell 31% compared to an average 56% in 19 other high—income countries* from 2000-2013.” The data appears on a strong downward trend. In the US, the three causes are approximately equal – intoxication, seat-belt non-use, and speeding. It is useful to know how these factors present in the selected Northwestern states of Alaska, Washington, Oregon, and Colorado. There are many differences between these states and, say, the Eastern Seaboard, that might bring confounding factors into play.
“Compared with 19 other high-income countries, the United States had the most motor vehicle crash deaths per 100,000 population and per 10,000 registered vehicles; second highest percentage of deaths involving alcohol-impaired driving; and third lowest national front seat belt use.”
The causal effects of legalization are not compelling and significant in the presence of such other causes and possible counfounding effects; but they are “truthy” enough for the Boston Herald.”
You make a very important point about controlling for confounding variables and assessing the odds that this was just a random fluctuation. Click the link to read the full article in JAMA and you will see the specifics of the study which address these issues. Our finding of an increase of 2.1 fatalities per billion miles was significant at p<.001. This did not happen at random, but there could be other explanations. For example, all the bad drivers could have decided to move to legal pot states.
Sounds like a no-brainer, but it is always nice to see the stats. Now let’s give the cops more work to do in establishing if there is any driver impairment involved in any accident. I would suggest a blood sample as last night’s Ambien ,Benadryl, whatever, may be a contributing factor. It would be nice to have all this info to drown ourselves in. The PI attorneys will love it……..deeper pocket with Big Pharma vs simply bad driver/distracted driver/ old driver with decreased cognitive skills and poor reflexes (I am an ophthalmologist). And then let’s tax the pot profiteers to pay for the injuries they inflict.
Thanks for your discussion of your research letter of June 22, 2020 in the JAMA-IM (JAMA Internal Medicine) , stating Change in Traffic Fatality Rates in the First 4 States to Legalize Recreational Marijuana, Russell S. Kamer, MD; Stephen Warshafsky, MD; Gordon C. Kamer
I am appalled at the Herald’s discussion that your publication and another “..suggested that laws legalizing recreational marijuana may lead to more traffic fatalities. We wouldn’t think a comprehensive study would be required to reach that conclusion.”
We have long ago passed by the popular and sciency trend of “proofiness” in statements about stuff, and have embraced “truthiness.” This coincided with the incredible profitability of the scientific literature, now commodified and long-departed from its mission to disseminate knowledge; and now contracted into a hierarchy of those who have the money to buy into the pub club, not coincidentally those universities and institutions which publish their own scientific journals.
I would love to read your research letter. It costs ten bucks to do so.